What day-to-day monitoring actually looks like

These are the screens you will be looking at once PulpShield is installed — the real interface, exactly as shipped. No mockups, no retouching.

🔒 The data shown belongs to a fictional company. No real information, and no address belonging to a customer or a third party.

One console, across the whole estate

PulpShield brings network monitoring (NDR) and endpoint monitoring (EDR) together in one place. No switching between tools: detection, investigation and response all live in a single interface, which keeps growing with each release.
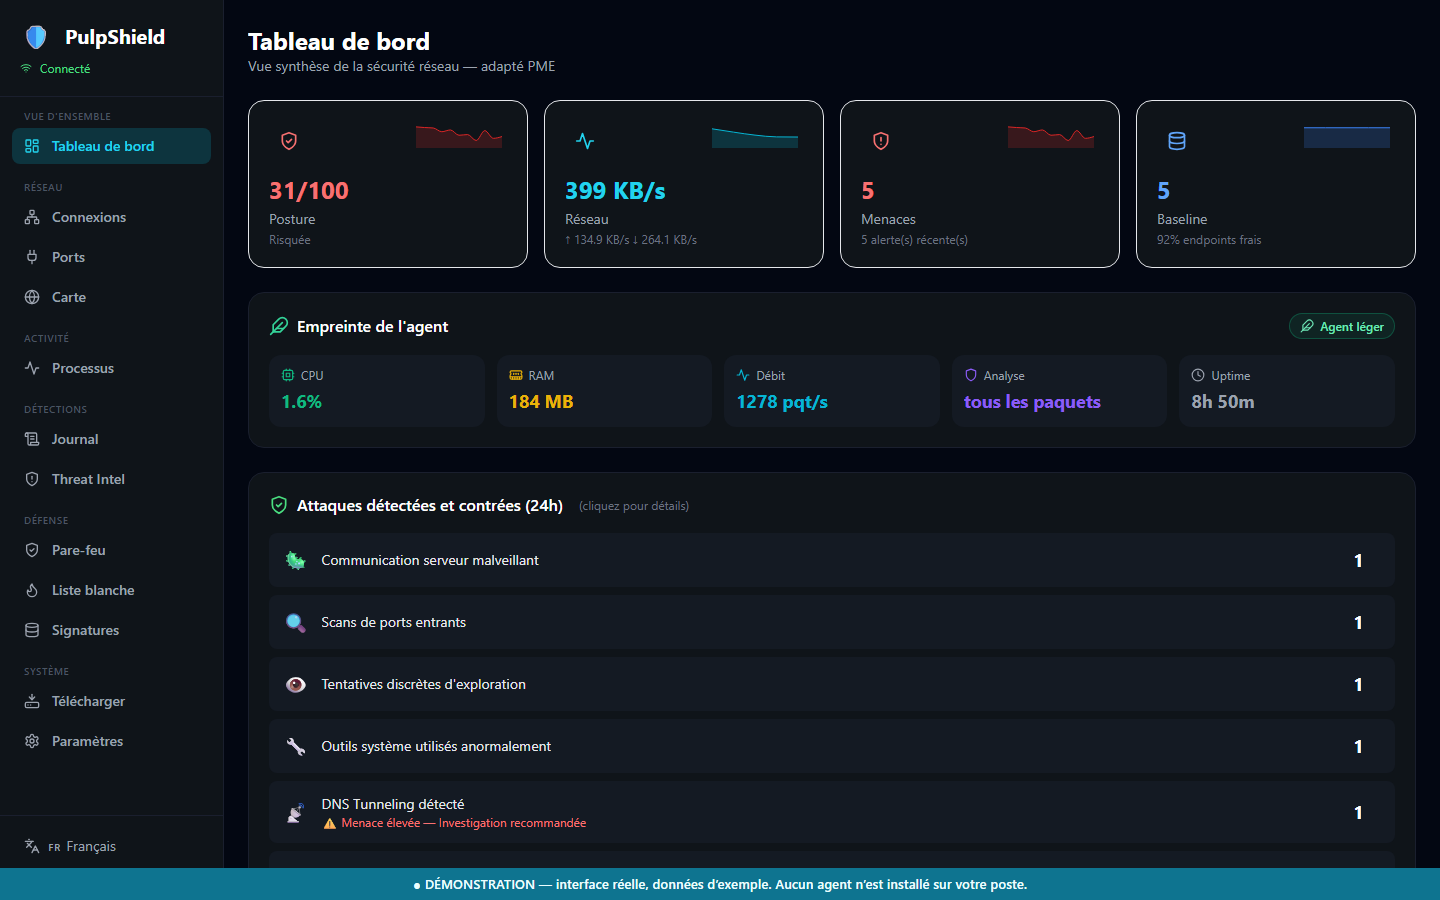
PulpShield dashboard: posture score, agent footprint and attacks detected over 24 hours
Overview Dashboard A posture score, active threats, and a breakdown of the attacks stopped over 24 hours. The agent's own footprint (CPU, RAM, throughput) is always on screen: you know exactly what it costs the machine.
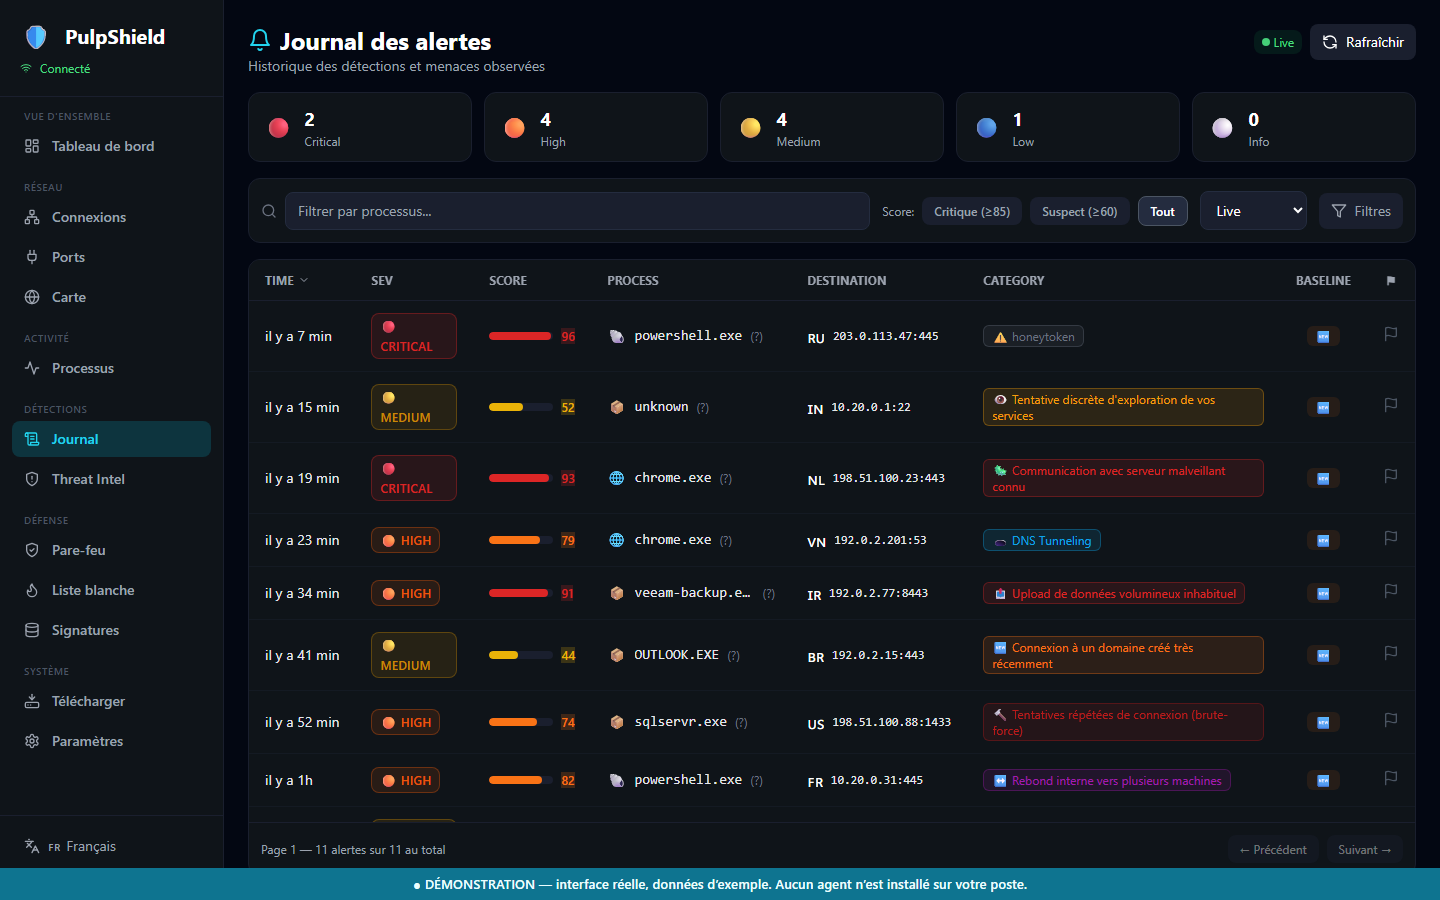
PulpShield alert journal sorted by severity, with anomaly score, process and destination
Detections Alert journal Every detection is written in plain language, not jargon: "communication with a known malicious server", "internal pivot across several machines". The offending process, the destination and the country are all there, with a severity score — enough to triage and decide without being a SOC analyst.
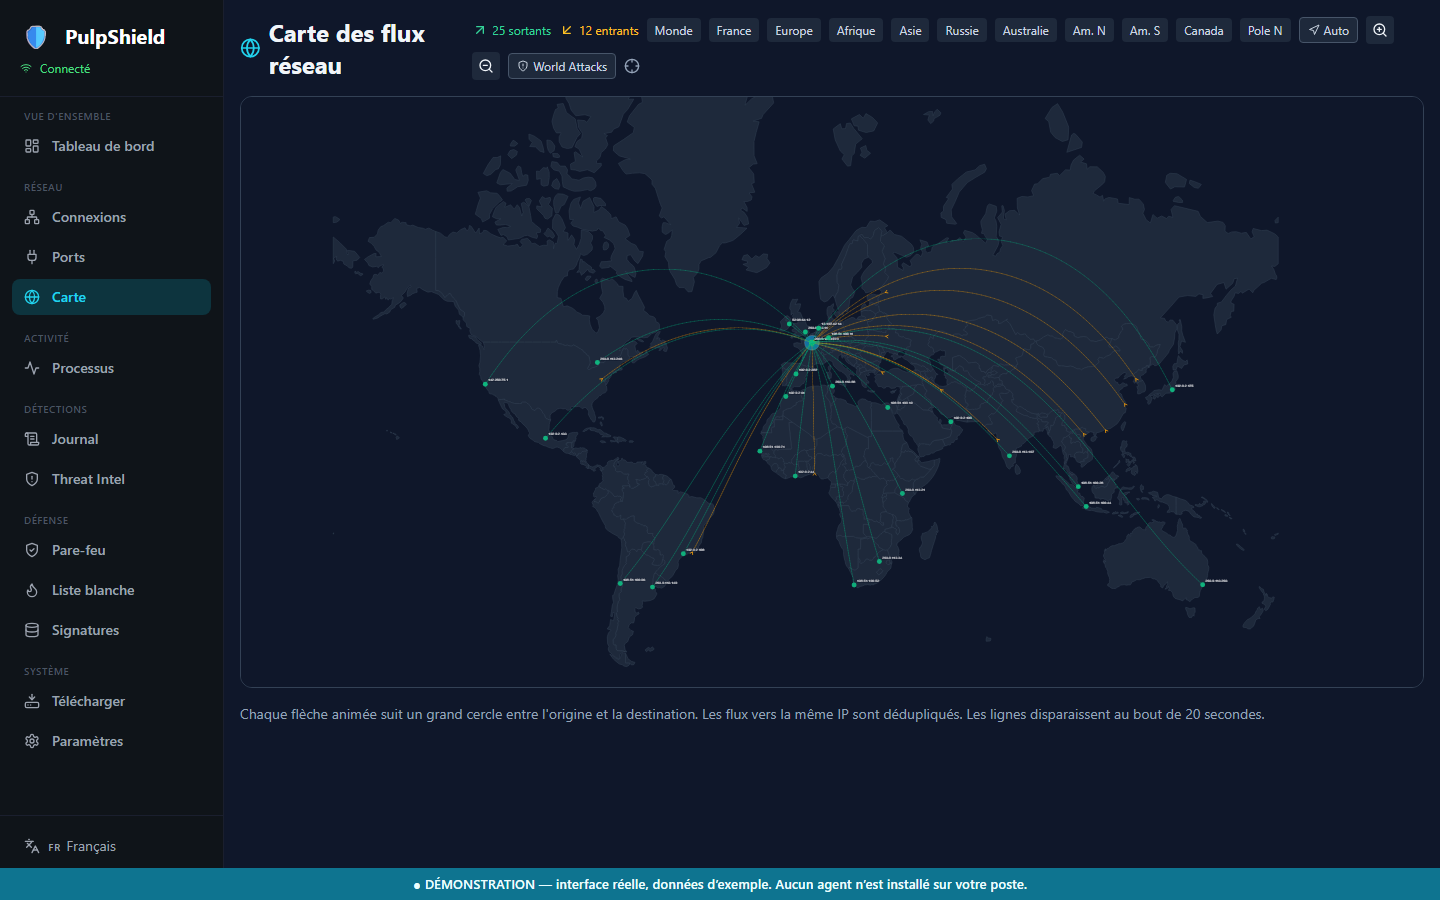
World map of network flows: 25 outbound flows to Africa, Asia and South America, 12 hostile inbound flows
Network Flow map Where your traffic actually goes. Here, a company trading with Kenya, South Africa, Brazil, India and Singapore — 25 outbound flows in green. In amber, 12 inbound flows from Russia, China and Iran. A connection to a country you do no business with stands out immediately.
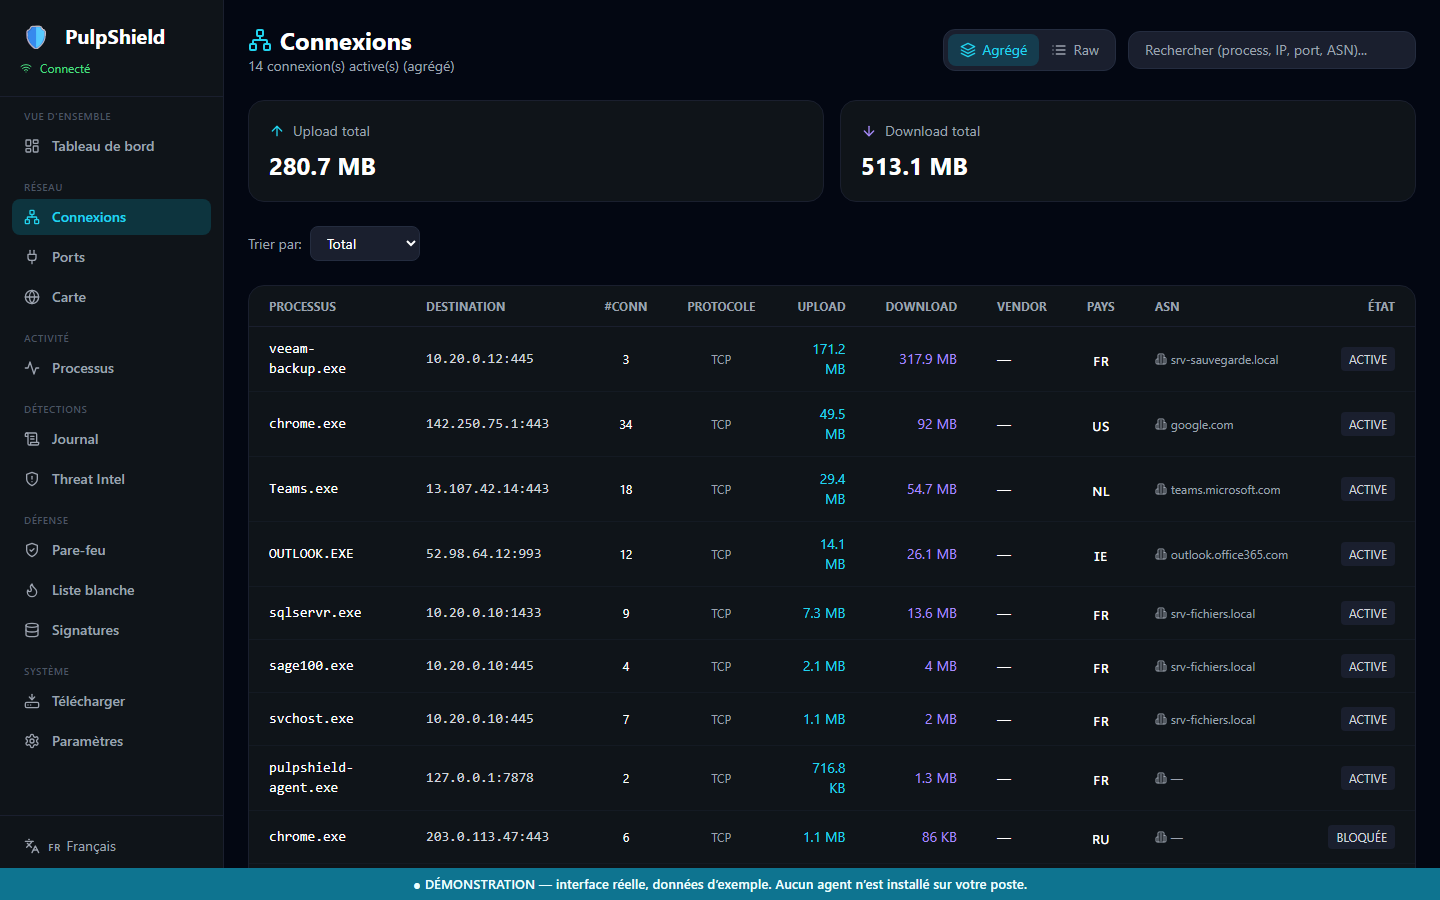
Active network connections per application, with country, ASN and blocked or active state
Network Connections Which application talks to whom, on which port, for how much traffic. Sessions to a hostile address show up as BLOCKED: the response already happened, you are simply seeing the record of it.
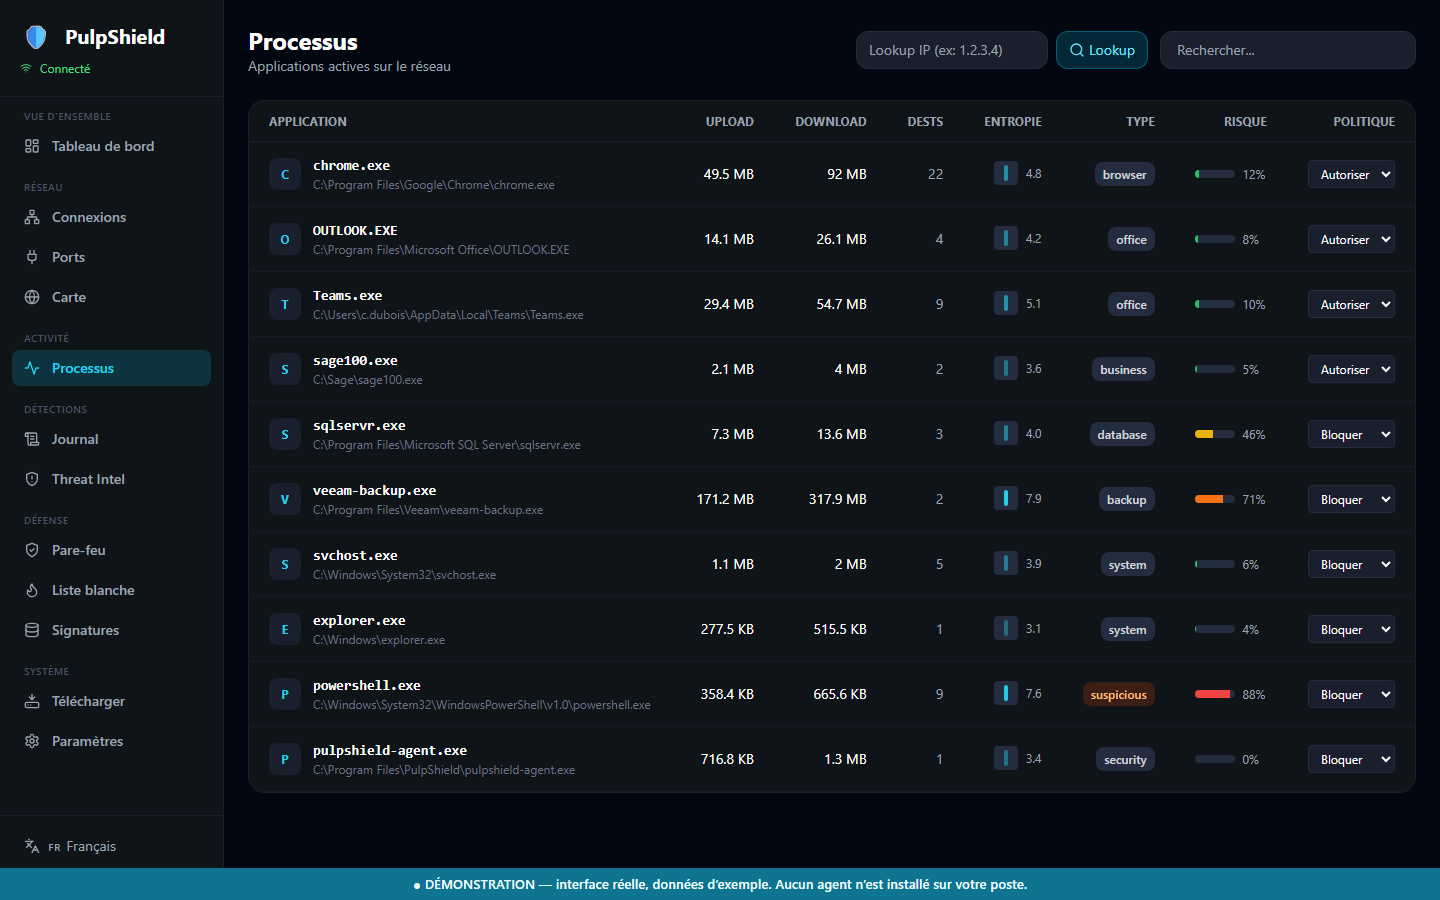
Process inventory with risk score, entropy and allow or block policy
Endpoints Processes An inventory of every application that communicates, with its risk score and average entropy — unusual encryption is a classic ransomware tell. Each program can be allowed or blocked from a single dropdown.
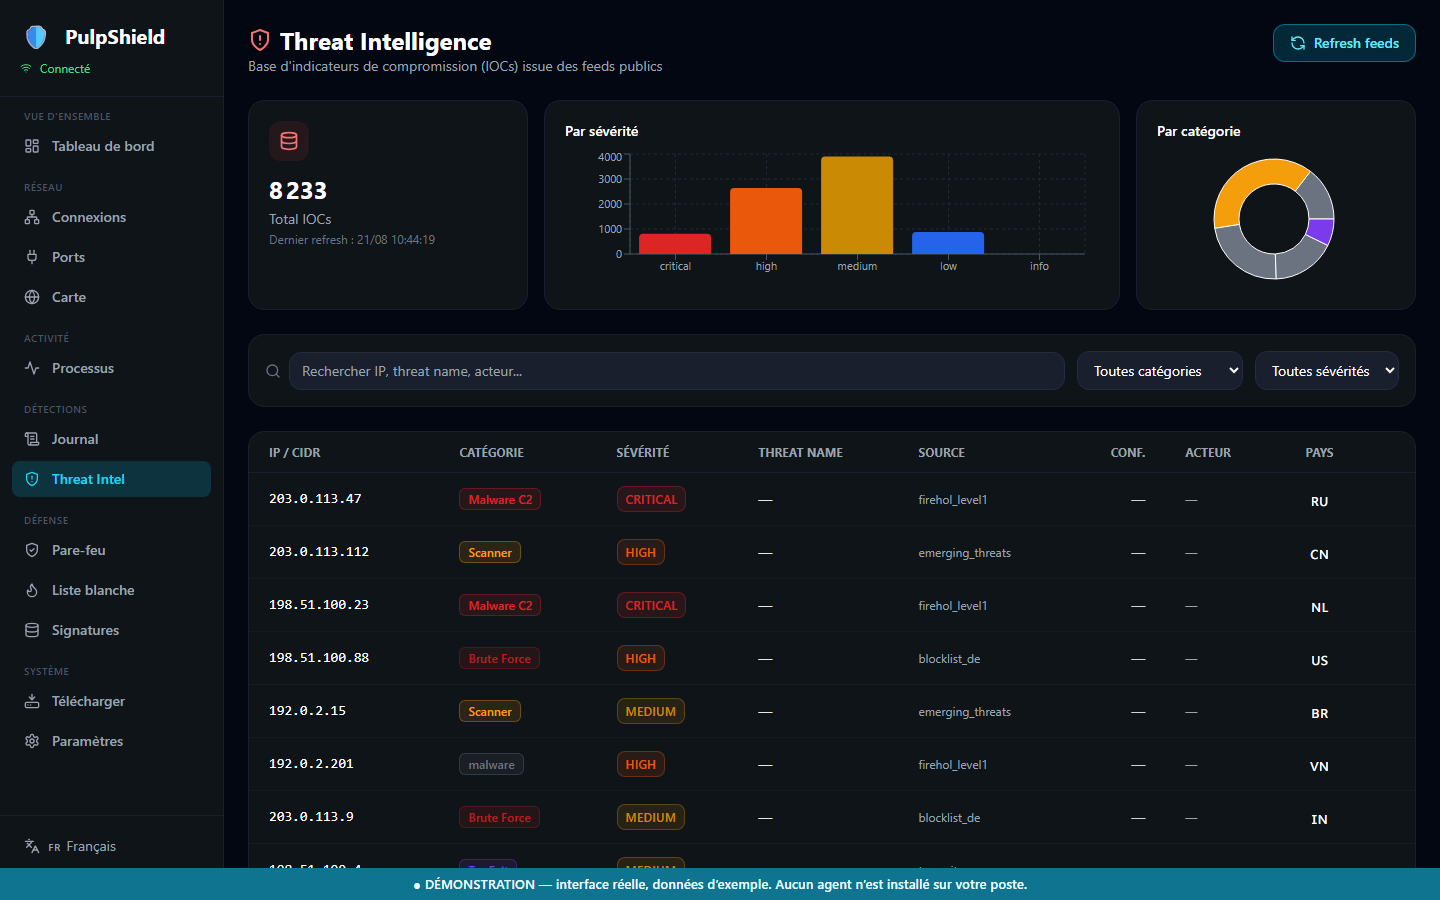
Threat intelligence: known malicious addresses by category and by source
Intelligence Threat intelligence Thousands of known malicious addresses, refreshed automatically from established public sources, sorted by category and severity.
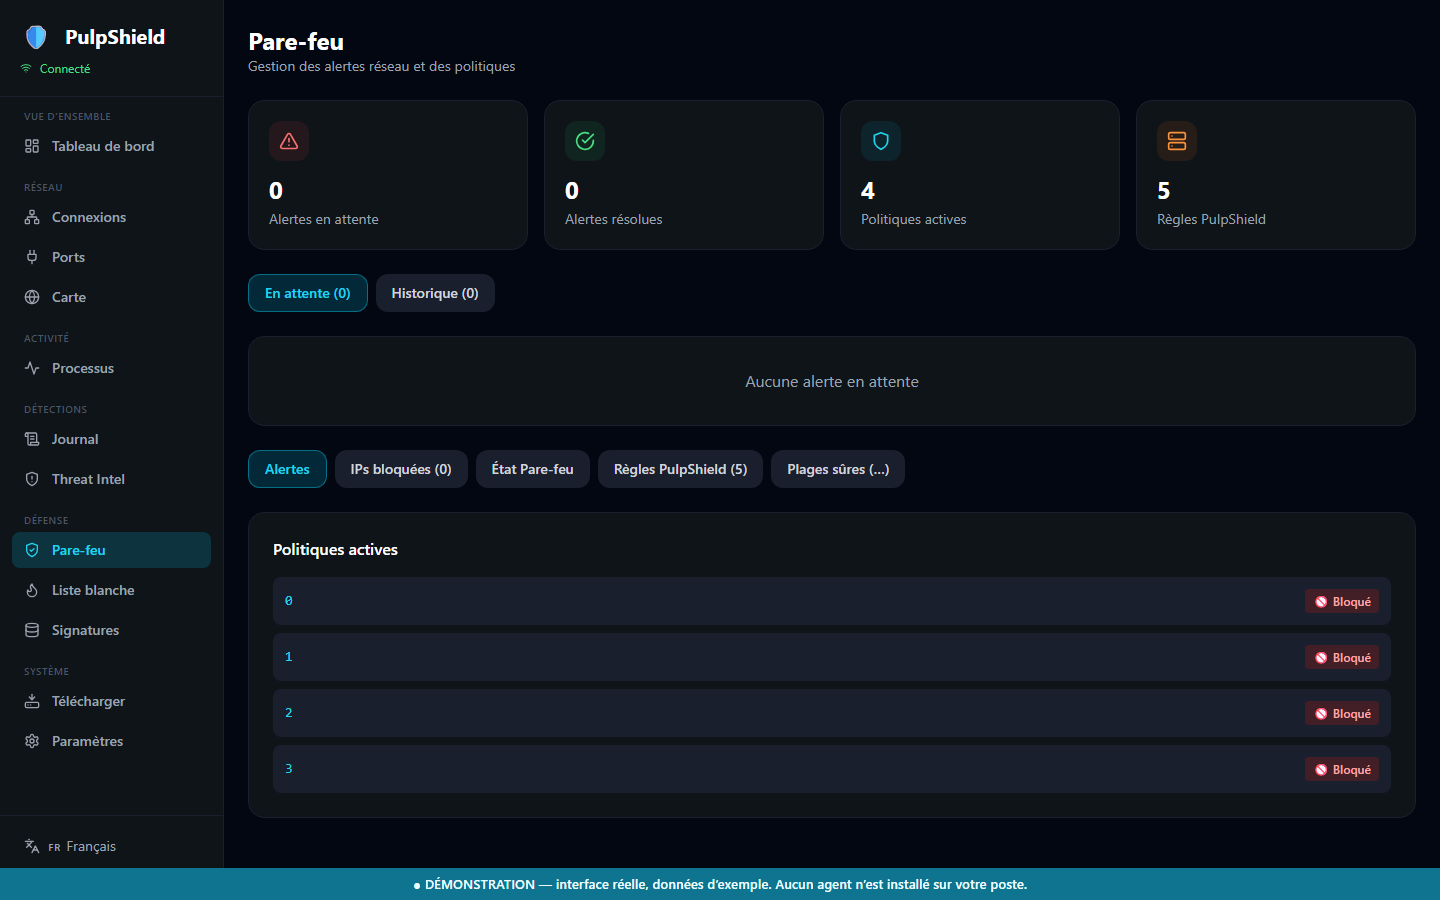
Firewall rules applied automatically by PulpShield, with reason and timestamp
Response Firewall PulpShield does not just raise alerts — it blocks. Every rule it applies is recorded with its reason and timestamp, and can be lifted in one click.
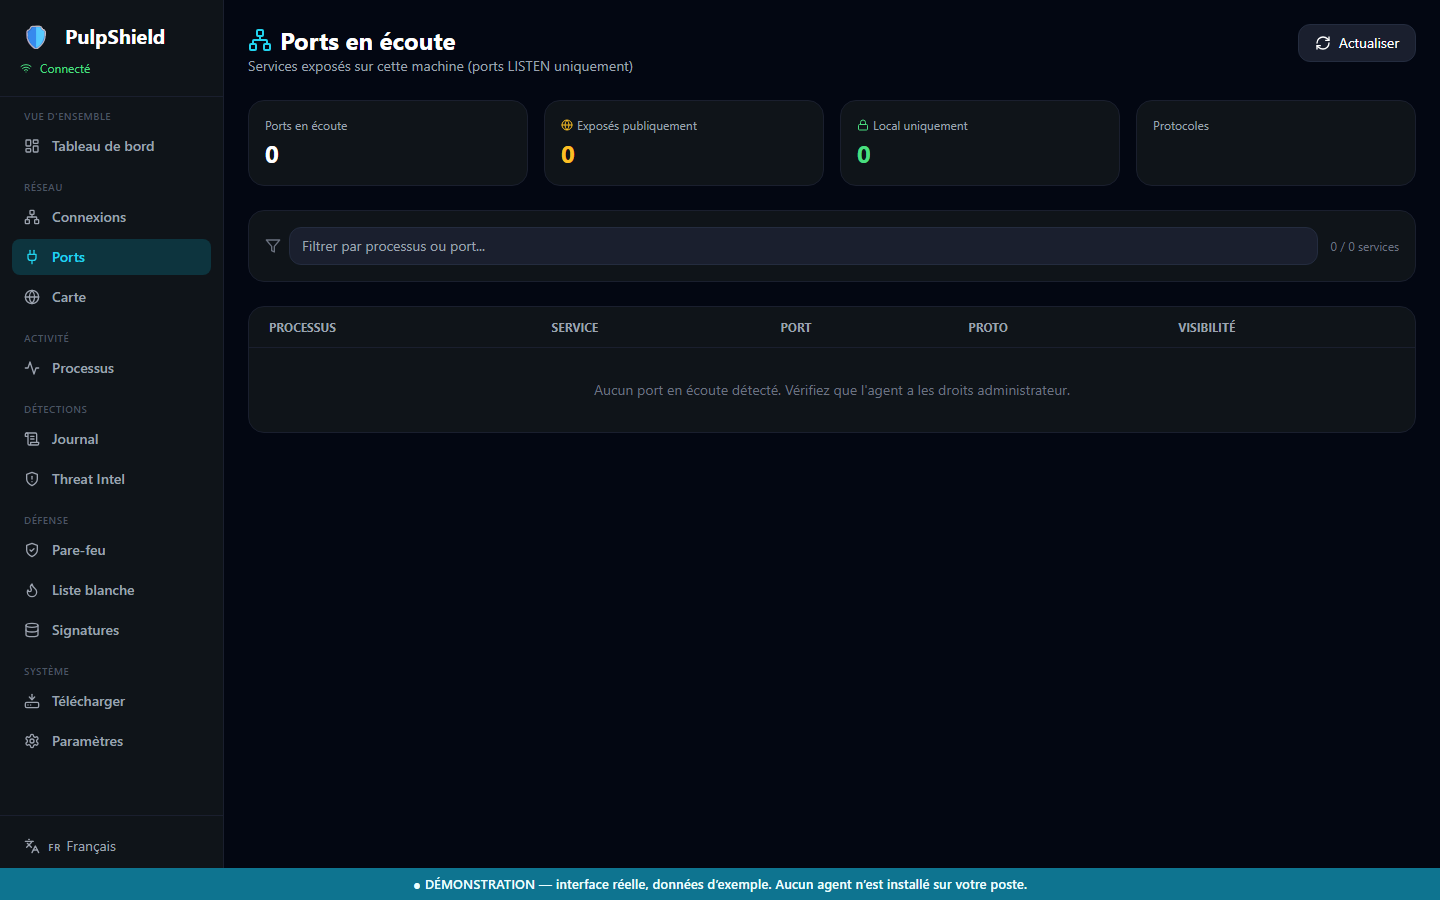
Listening ports on the machine, with associated risk level
Endpoints Listening ports The machine's exposure, port by port, with the matching risk level. This is often where an intrusion starts: a remote desktop left open and forgotten.

This interface is clickable

The live demo runs this exact interface in your browser, on a sample dataset. Nothing to install, nothing to uninstall.